
The Starting Line: Australia's National Capability Benchmark
.jpg)

Founder and CEO of Future Anything, Nicole Dyson is a multi-award-winning educator and entrepreneur, and a global authority on project-based learning, entrepreneurial pedagogy and school transformation. A former school leader in Australia's public system, she also founded YouthX (Australia's only startup accelerator for school-aged entrepreneurs) and Catapult Cards (design thinking toolkit that donates 50% of profits as micro-grants to youth-led startups).
I had a meeting with a Principal I respect doing remarkable work in their regional public school recently.
They asked me how I did “it’.
By “it” they meant, maintain the passion for the work amidst a system that sometimes feels heavy and hard.
I said it’s easier on the good days.
Over the last eighteen months, as pedagogy has been increasingly politicised and weaponised in the creation of a binary battlefield of seemingly 'good' teaching and 'bad' teaching… The good days have been a little fewer.
Twelve months ago, I wrote an opinion piece ‘Under His Eye’ naming some of my concerns about the overreach of some to mandate a narrower approach to pedagogy in classrooms.
I shared my concerns about a low variance approach to curriculum, when it's applied militantly and without the lens of teacher expertise, community context and student needs.
I lamented the conveniently selective interpretation of cognitive load theory being trotted about as a reason why structured inquiry can't work.
I expressed my fear that the more we make learning about achievement, the further we might find ourselves from joy - the one ingredient that might encourage students to show up for class, and teachers to stay in the profession.
The blog was was... a little polarising.
As a result, I found myself in difficult conversations having to justify almost two decades of experience in education with people who…well, some had never taught in a classroom, and many hadn’t even read past the first few paragraphs.
If they had, they would have seen that I’m not anti-anything.
I'm not anti-The Science of Learning. I'm not anti-Explicit and Direct Instruction. I'm certainly not anti-cognitive load theory.
I'm pro-sequencing; wielding pedagogy for purpose.
Novices do learn the foundations best through explicit, structured teaching. Systematic phonics, worked examples, retrieval practice - this research base is decades deep, real and hugely effective when applied in the contexts from which it was intended.
The reality is, though, that once novices have a handle on the basics, there is significant research to support that structured inquiry outperforms pure-form explicit instruction - yes, even on exams. Yes, even for some of our most disadvantaged students.
Randomised controlled trials led by researchers at the University of Southern California across thousands of students found that rigorous project-based courses - structured, with explicit instruction embedded within the learning sequence, outperformed traditional lecture-based courses on the AP exam by 8 percentage points.
This doesn’t contradict cognitive load theory. In fact, the expertise reversal effect, one of cognitive load theory's documented effects, finds that the scaffolding novices need can begin to actively harm learning as expertise grows. When experts receive extra scaffolding or redundant step-by-step guidance, they must waste working memory capacity processing information they already know. This extra mental burden causes cognitive overload, which reduces learning efficiency and overall performance.
The hammer is the right choice to get the nail in.
But, try building a whole house with only a hammer.
(This analogy might be a bridge too far for someone that still calls a hammer the “thingy”)
If you want to see what building with only a hammer looks like, it's sitting in this year's NAPLAN data.
I spent some time diggging into this data. Aside from exploring the trends in year-on-year growth, and finding some worrisome gaps in who was missing from the data, I found this year’s Writing results particularly curious.
[See more on my messy NAPLAN musings, and some pretty graphs here]
Now, I'm not a Maths teacher.
But, I am an English teacher.
And, whilst you can (and probably should!) explicitly teach the structure of a short story, Writing is the only NAPLAN domain you can't regurgitate your way to success.
Unlike most other standarised tests of this nature which often rest in the domain of predictable, transactional 'asks', Writing asks you to produce something entirely new under unpredictable, transformational conditions.
This ask is quite different - and the Writing data shows this.
Writing is the only NAPLAN domain where the bottom grows - from 6.7% in Year 3 to 12.8% in Year 9. Interestingly, this happens at the same time that the top nearly triples.
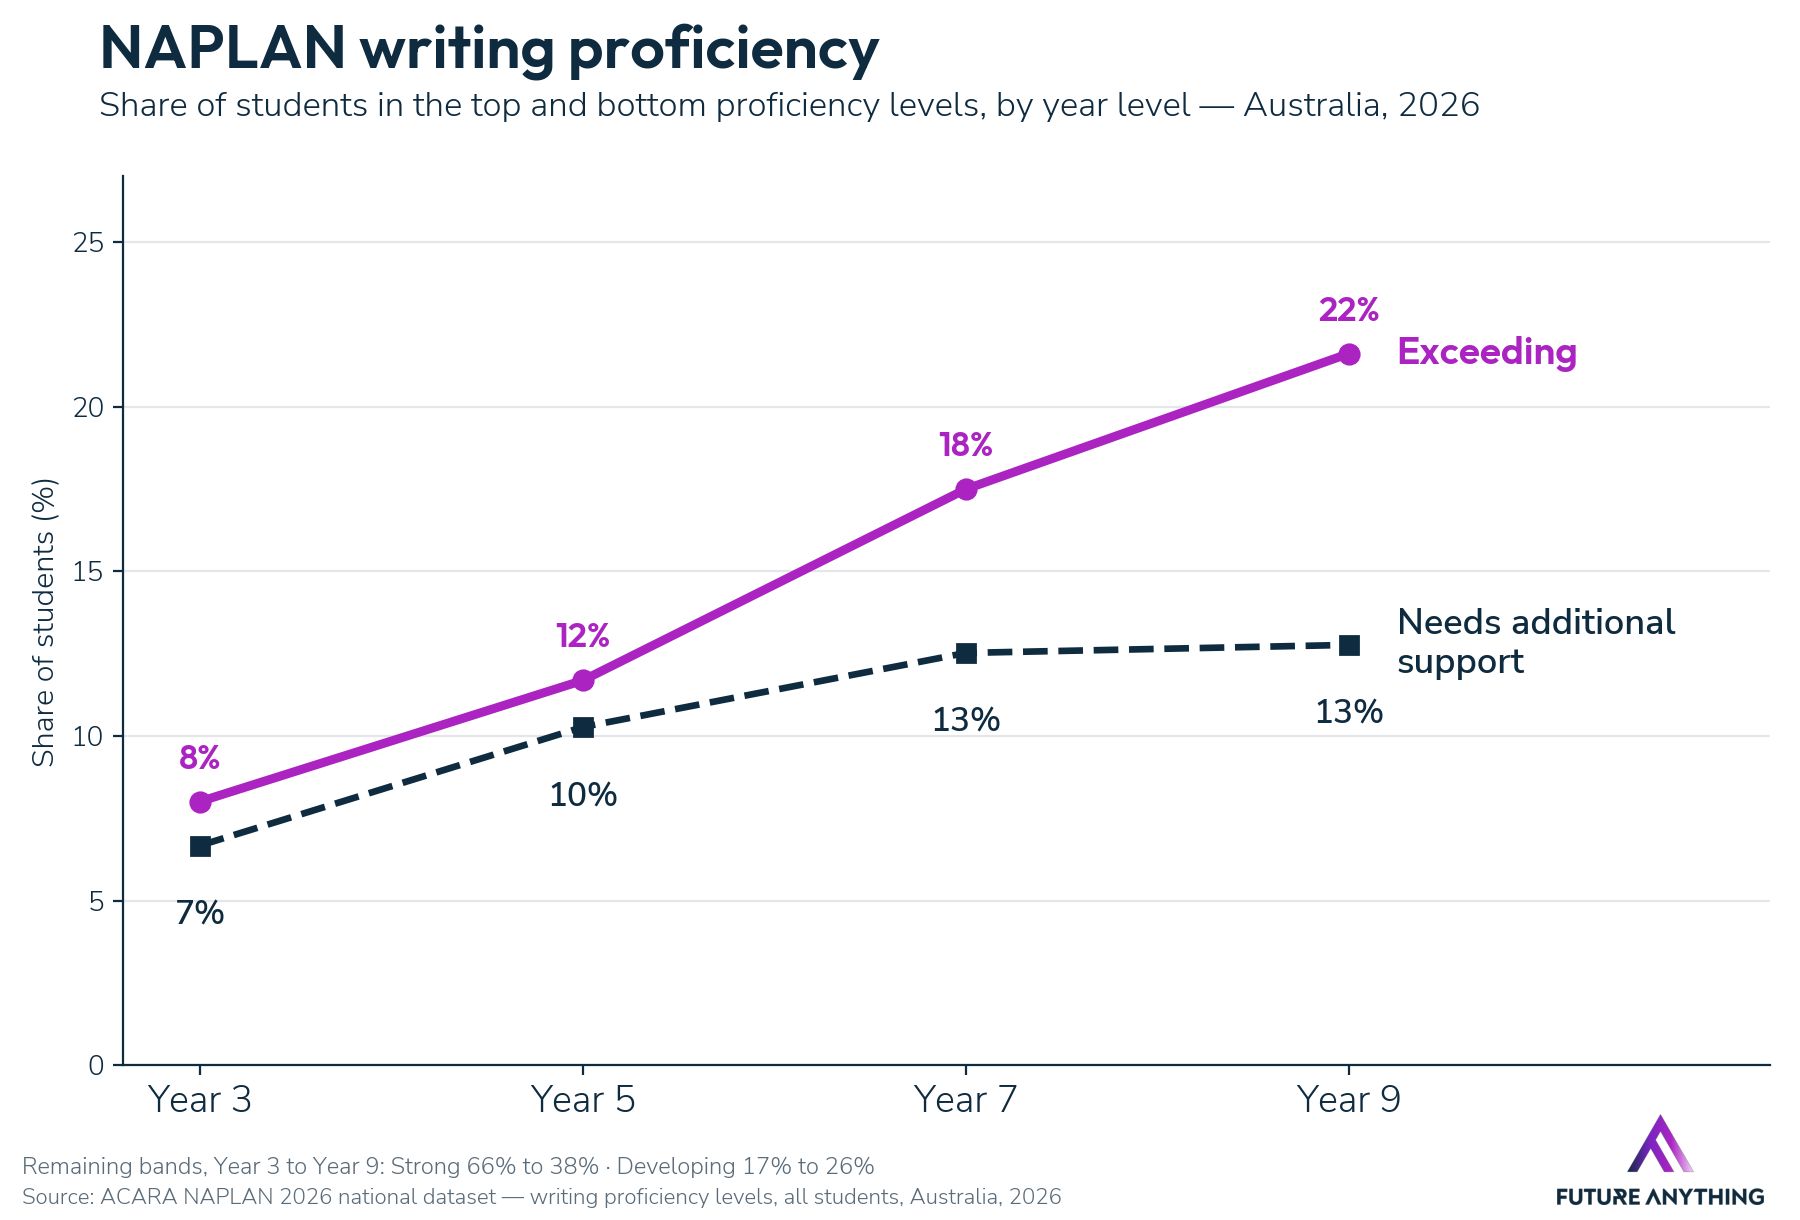
What gets really interesting is when we look at who pulls ahead.
By Year 9, 1 in 3 students with degree-holding parents are Exceeding in writing.
For students whose parents finished Year 11?
Only 1 in 16.
Explicit teaching can hand every student the structure.
But producing new things under uncertain conditions?
That’s a whole different capability.
And, if these capabilities aren't built at school, then where?
For me, Writing feels like the canary in the coal mine.
And, it’s this canary that helps us see why a capability-rich approach to learning might be critical, even if our goal is content mastery.
If you’re one of my naysayers (thank you for still reading past the first paragraph!), I know what you’re thinking.
There’s no proof that capabilities link to content mastery.
But, I think I might have found this thread.
As you may already know, within our Future Anything Challenge program, students (and teachers) are benchmarked across our six capabilities.
Using Likert Scales, students self-reflect on their understanding of, and confidence in the six capabilities in our Future Anything Capability Framework.
Every question starts with "I can..." For example,"I can ask questions when I don't understand
something or feel stuck." Students then answer on a five-point scale that moves from "I don't know what this is or how to do this" through to "I can do this so well that I can teach others to do it."
This year, 3,582 students from 64 schools completed the pre-program survey.
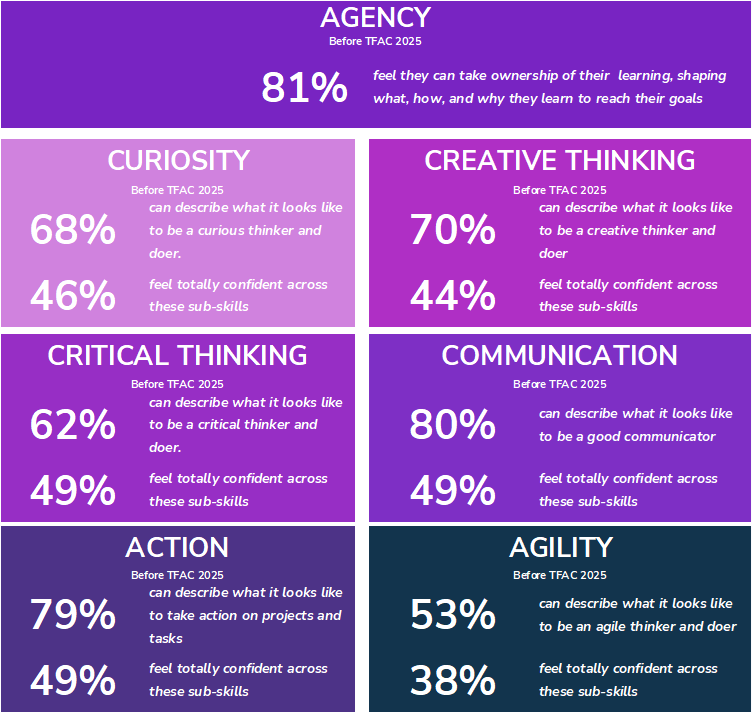
If you’ve seen me speak over the last few years, you’ll have seen me present the aggregated data; the capability profile of the entire Challenge cohort for any given year.
It looks a little like the below image. Student's self-reporting on student's self-reported understanding of each of the capabilities appears in the top line, along with the aggregated self-reported confidence of doing the capability (bottom line).
But, I recently went far deeper into the data than I'd ever gone before, splicing it by school demographic.
And, this is where things got a little scary.
When we cut the data in this way, regional students started behind their metro peers on everything we've ever measured.
When we added in the layer of school sector… The distance doubled.
Regional public school students, on average, start more than 14 percentage points behind their advantaged metro counterparts.
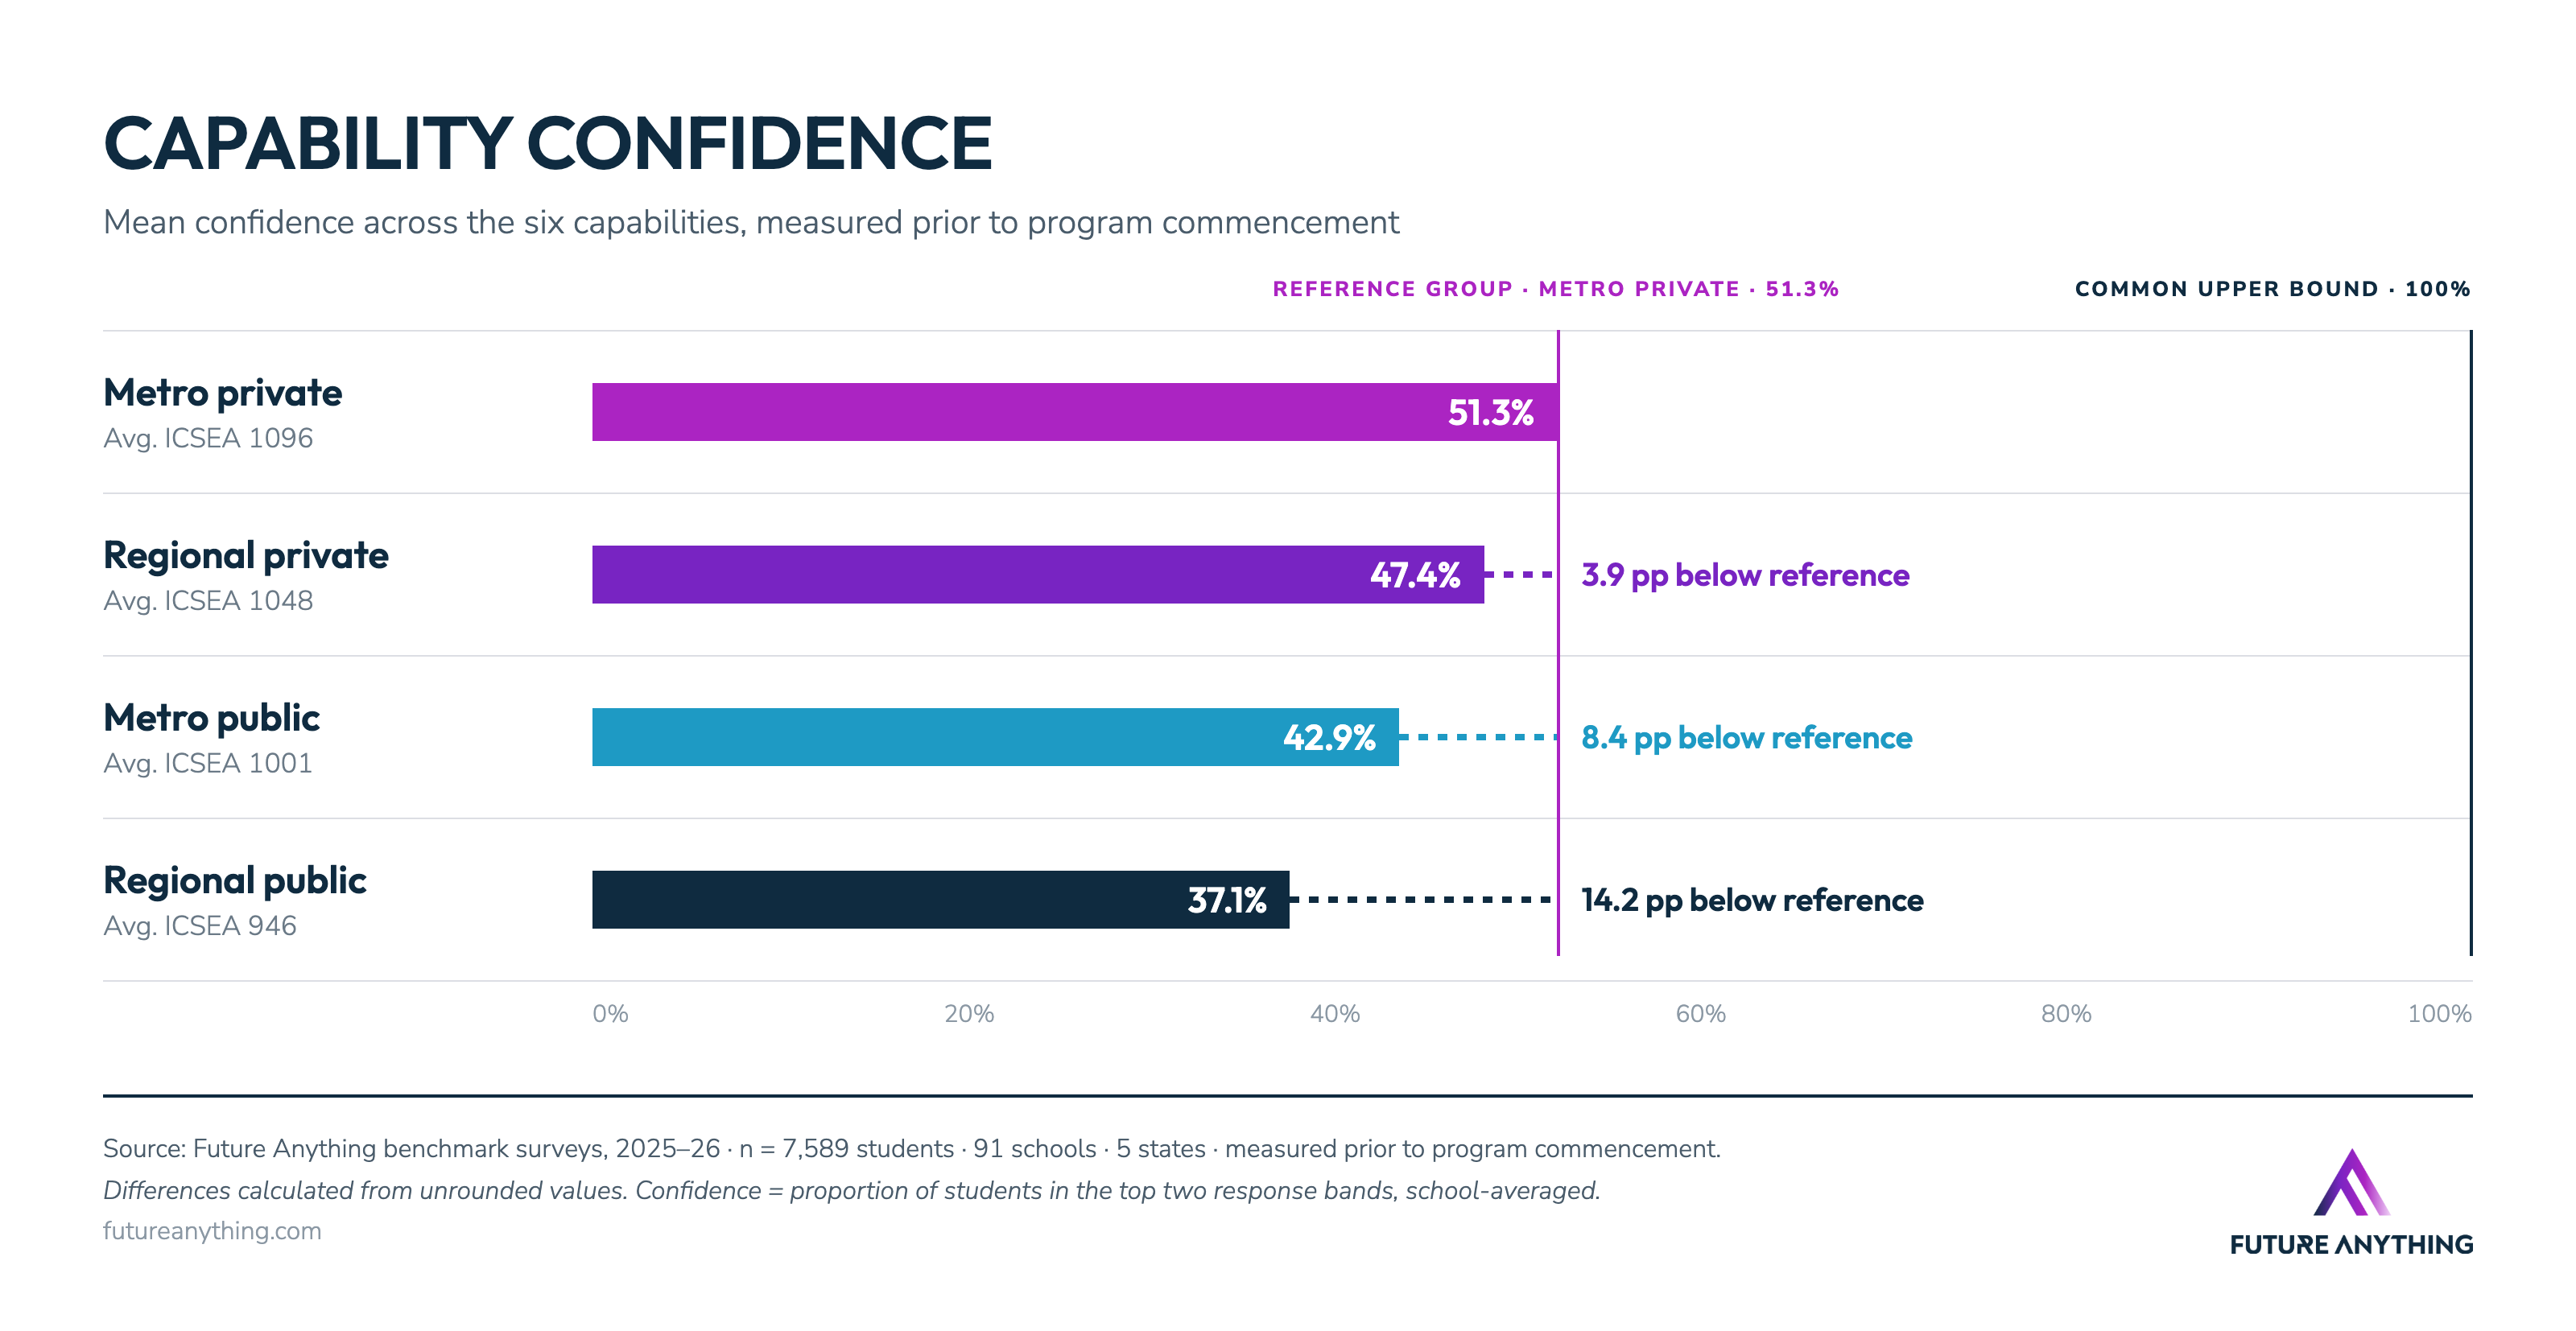
Same finish line. Very different starting line.
A little horrified, I went back and checked this against our 2025 data.
The 2025 data set included 4,007 students from 72 schools, half of which were different schools to those who appeared in the 2026 data, and most (if not all) were entirely different students to the 2026 data.
Where the demographic profile of the sample held steady, the starting lines reproduced almost exactly - within a single percentage point.
Where the sample's demographics (ICSEA) shifted, the starting line shifted accordingly.
Different students, different teachers, different schools, same outcome: the starting lines track demographics.
Two things follow from this.
The first is about the lesson you're teaching on Monday.
Inside the curriculum for our Future Anything Challenge, each lesson in the twenty-lesson unit is mapped to a single target capability - this is always the capability that is most intrinsically linked to the student's success within that specific lesson.
Think about an English lesson where students are doing a close text analysis. The target capability for that lesson would likely be Critical Thinking.
Or perhaps, in Maths, students are receiving formal feedback on their PSMT. That lesson would likely map to Agility.
Now, if you take that lesson by lesson capability mapping and overlay a cohort’s capability profile, suddenly you can map the experience of a unit by the students.
In this way, how a student, or students, experience the same lesson can vary vastly depending on their capability profile.
If they're lower in Critical Thinking, the lesson that relies on this capability will feel harder.
If they're a confident Communicator, the lesson that relies on this capability will feel easier.
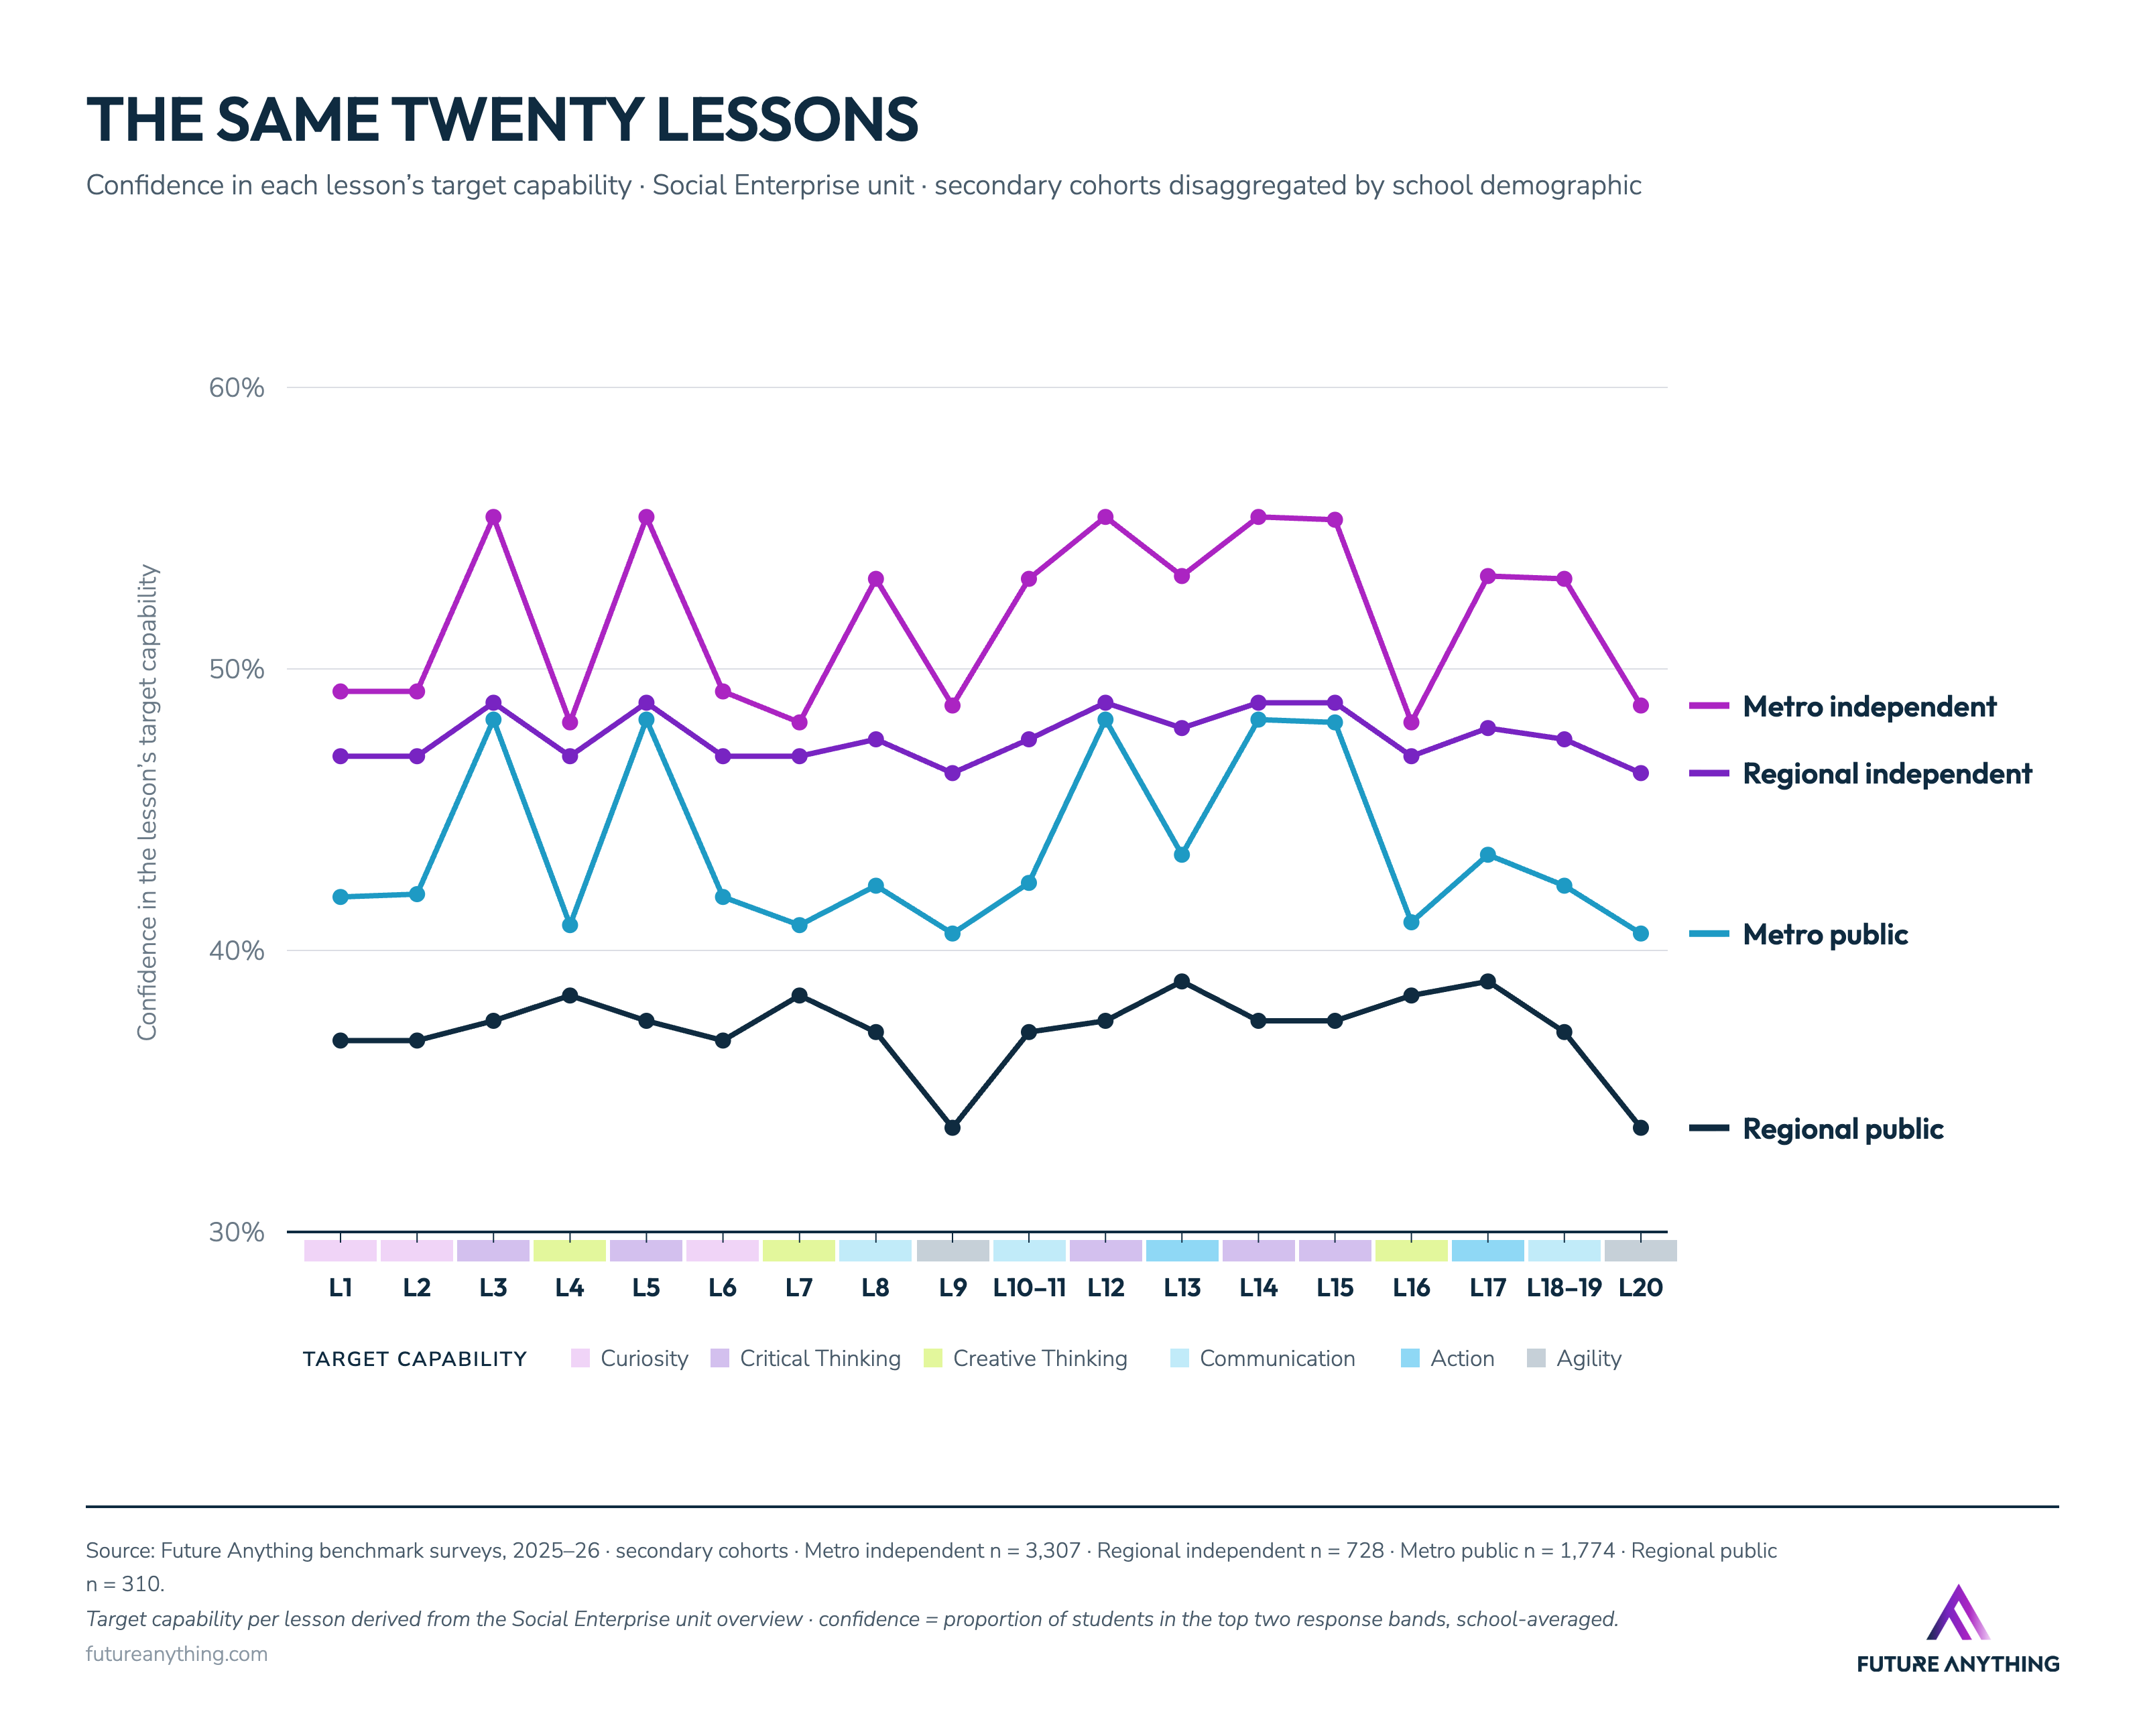
The level of challenge in the lesson is felt through the lens of the student's capability profile.
Same content.
Same teacher.
Same pedagogy.
Very different experience.
This matters because perceived challenge shapes engagement.
Engagement shapes success.
Which means capability isn't competing with content.
Capability is the mechanism through which content can be mastered.
The second finding is perhaps the thing that surprised me the most.
In PISA maths proficiency, regional students trail metro students by fifteen percentage points.
In PISA reading, by eleven.
In Year 12 completion, by about eleven percentage points again.
Those gaps are measured every cycle, reported nationally, and funded accordingly.
The capability gaps we found between the same demographics?
They are the same size.
This, my friends, is a mighty coincidence.
Or, perhaps it isn’t a coincidence at all.
Now, before my naysayers cry chicken and egg - you're right. Four decades of self-efficacy research tells us this relationship runs both ways: mastery builds confidence, and confidence builds mastery.
I honestly don't know which one is the chicken and which one is the egg.
But, maybe this isn't an 'or' conversation - it's an 'and' conversation.
What if capabilities could be leveraged to supercharge our work in the places we feel most worried about students' success - literacy, numeracy, Year 12 attainment, ATAR, and post-school pathways?
It's not the whole recipe.
There's no silver bullet in education.
[Random aside, fellow English teachers, are you proud of how much figurative language I've managed to cram into this...?]
But it could be one of the key ingredients.
And right now, it's the one ingredient nobody is measuring.
Which brings me back to that Principal, and their question.
How do I maintain ‘it’?
The passion.
It’s the young people on the other side of these numbers.
The young people starting 14 percentage points behind in a race they didn't even know they were in.
Our young people don’t need us to pick a side in the pedagogy wars.
They need us to build the whole house. Using all the tools at our disposal.
This is where you come in.
For the last five years, our data has come from the schools running our programs.
But, from today, we’re opening up this benchmark to every Australian school.
It’s called The Starting Line - Australia’s National Capability Benchmark.
It’s a free anonymous survey you and your Year 5-12 students can complete in 7-10 minutes. We want to make capability profiling apart of every evidence conversation - enabling every school to leverage their NAPLAN data, their ATAR results, and their capability profile to the table.
Register a class, a cohort or your whole school. And, get real data on where you're young people are starting from.
Through your participation in The Starting Line, your school will receive a detailed report of your student's results, including side-by-side cohort comparisons where you register your whole school.
[Some of our work in whole-school capability mapping is revealing some fascinating trends in year levels. What shape is your school? A U Shape? High confidence in upper primary, lower in middle school, higher again in upper secondary. Or, are you The Cliff? High, until one sub-school transition means confidence takes a dive...?]
But, maybe most importantly, you’ll contribute to the 2027 release of The Starting Line Report; a national picture of where Australia’s students and teachers actually begin.
We want to make sure that no student starts behind.
And, here's why that's worth your time: The gaps that get measured are the gaps that get funded.
The capability gap is the same size as other gaps we resource accordingly - but it's invisible. Every school that takes part makes this harder to ignore.
And, every kind of school matters. Because if the only schools that show up are the ones with the headstart, the national picture inherits the very skew we're trying to expose, and reconcile.
I can't do this without you.
Because we measure what we value. And we value what we measure.
It’s time we measured the whole house.
Centre for Education Statistics and Evaluation (NSW), Cognitive load theory: Research that teachers really need to understand (2017).
Kalyuga, S., Ayres, P., Chandler, P., & Sweller, J. (2003). The expertise reversal effect. Educational Psychologist, 38(1), 23–31.
Saavedra, A. R., et al. (2021). Project-based learning in AP classrooms: Lessons from research. Phi Delta Kappan.
Saavedra, A. R., et al. (2021). Knowledge in Action efficacy study over two years (the full randomised controlled trial). USC Dornsife Center for Economic and Social Research.
ACARA, NAPLAN national results.
ACER, PISA in Brief 2022 (metro–regional proficiency gaps: 15 percentage points in maths, 11 in reading).
ACARA, National Report on Schooling in Australia 2022, Chapter 8: Student Attainment (Year 12 certification by geolocation).
Under His Eye — the original opinion piece this blog answers.
Nicole's NAPLAN 2026 analysis — LinkedIn post.